TransparentChoice can help you with...


Lessons from Real Customers
Trusted By
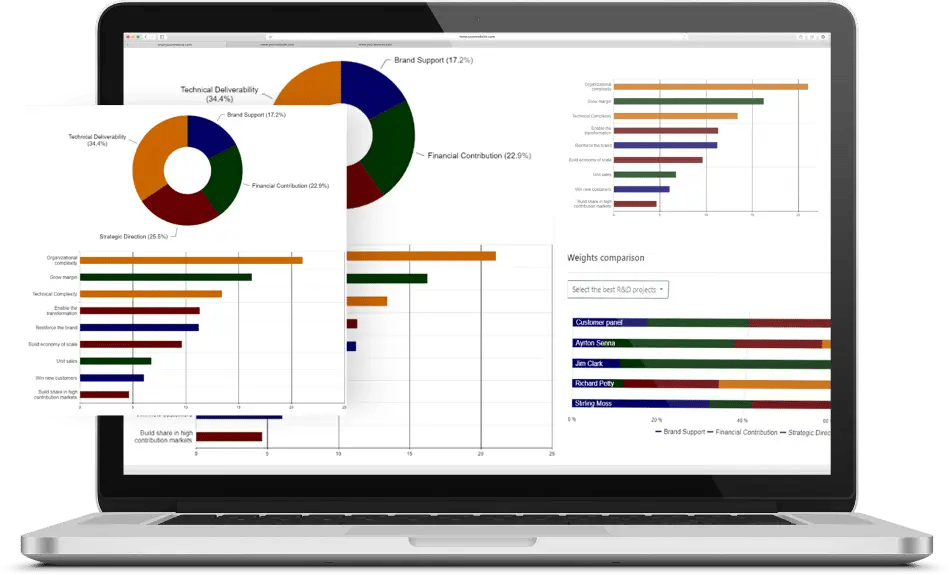
TransparentChoice software takes decades of proven decision science and makes it accessible for anyone
AHP works
Analytic Hierarchy Process (AHP) is a decision science methodology with proven value. Independent research identified it as the best solution for project prioritization, while it’s application in solving complex decision making has been proven by the likes of Nasa, Boeing, Toyota.
At its core is a ‘pairwise’ algorithm that uses relative importance to create selection criteria. For our clients the software does this work, while our expertise helps turn AHP into competitive advantage.

Teams perform better than people
Your organizations’ most valuable assets don’t sit on your balance sheet. They sit on your chairs. We believe the key to winning in a knowledge-based economy is the knowledge of your people and that syndicating different perspectives delivers better outcomes than shouting on Zoom.
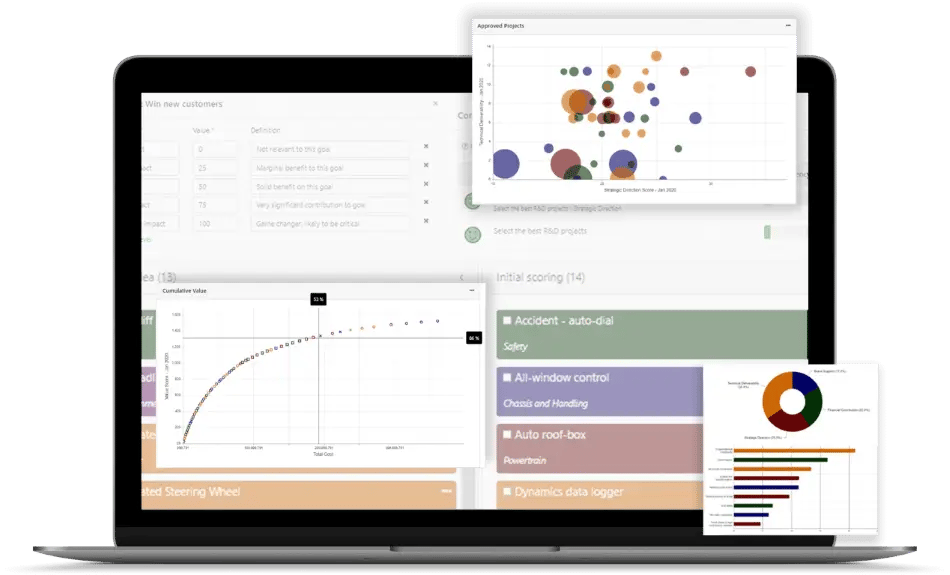
Our solution is designed to facilitate this collaboration, while reducing both Noise and Bias, delivering governance friendly transparency and a quantifiable basis for rational decision making.

Software beats spreadsheets
Spreadsheets are fantastic – but not for project prioritization. They may be ‘free’ but they will generate huge cost if you factor in lost velocity, resource to build, and the impact of Bias & Noise. You wouldn’t use a spreadsheet for accounting, data warehousing or lead generation... so why use it for complex decision making?
Our solution makes it easy to benefit from the power of teamwork, integrating automation and data visualization solutions designed to enable our clients to win with AHP.